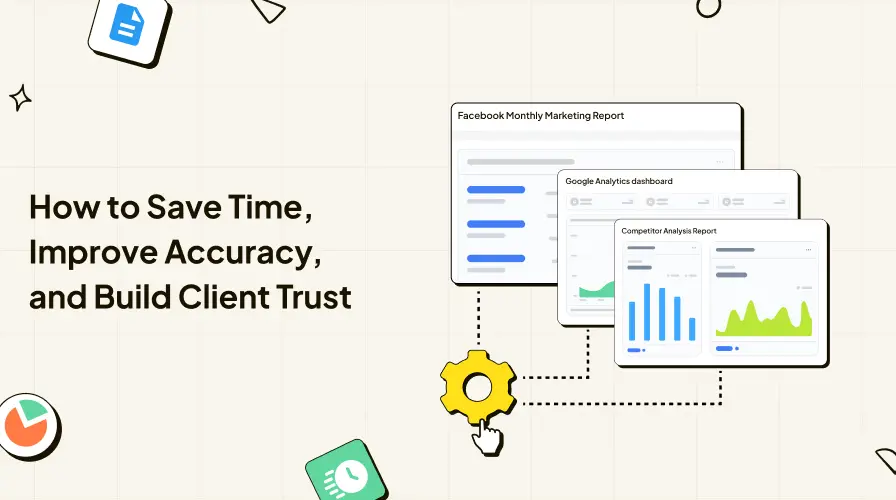
Automated Reporting: How to Save Time, Improve Accuracy, and Build Client Trust
Reporting is one of the most important ways businesses communicate performance, whether it’s with clients, stakeholders, or internal teams. But as the volume of data grows, so does the time it takes to pull numbers, clean spreadsheets, and format reports.
This is where automated reporting comes in. In simple terms, it’s the use of technology to collect data, process it, and deliver reports with minimal manual effort. For marketers, agencies, and enterprises, automation not only saves time but also improves accuracy and consistency.
That said, reporting isn’t just about numbers, it’s also about the story behind them. The most effective strategies balance automation with human interpretation, ensuring reports don’t just inform, but also build trust. In this blog, we’ll guide you from the basics to advanced strategies for automating reports.
1. Understanding Automated Reporting
1.1 What is Automated Reporting?
Automated reporting refers to the use of automation tools and reporting software to automatically generate reports from raw data without the need for repetitive manual data entry. Instead of analysts spending hours collecting spreadsheets, cleaning data, and formatting presentations, automated reporting systems collect data from multiple sources, process it, and present it in pre-defined templates. The result is a consistent, accurate data flow that can be accessed by relevant stakeholders in real time.
1.2 How Automated Reporting Systems Work
At a high level, automated reporting systems connect to your data sources, pull in raw data, process it into accurate, structured information, and deliver it as reports or dashboards. These reports can be automatically generated at set intervals, giving relevant stakeholders real-time visibility without the burden of manual reporting.
1.3 Manual Reporting vs Automated Reporting
Manual reporting often requires collecting spreadsheets from different teams, entering data into Google Sheets, verifying numbers, and formatting visuals. This process is prone to human error, delays and inconsistent results. On the other hand, automated reporting eliminates repetitive manual tasks, ensures up-to-date information and delivers interactive dashboards that allow teams to explore business intelligence on demand.
The difference can be summarized as:
Manual reporting → Time-consuming, error-prone, resource-heavy.
Automated reporting → Scalable, accurate and capable of automating data collection across multiple platforms.
1.4 Types of Automated Reporting
Automated reporting isn’t one-size-fits-all. Different organizations adopt different types of reports based on their needs:
Operational Reporting → Tracks daily performance, key performance indicators and internal data reporting workflows.
Financial Reporting → Automates financial data tasks such as income statements, cash flow statements and compliance-ready reports.
Marketing Reporting → Focuses on marketing data and customer data across ad platforms, helping agencies evaluate campaign ROI.
Business Intelligence (BI) Reporting → Uses advanced data analytics and BI tools to deliver actionable insights from multiple data sources.
Interactive Reports → Provide customizable dashboards and the ability to create interactive reports for executives and key stakeholders.
By understanding these categories, organizations can choose the right automated reporting tool that fits their goals, whether that’s consolidating financial reporting processes, simplifying data analysis or scaling marketing dashboards.
2. Key Benefits of Automated Reporting
Businesses, agencies and finance teams adopt automated reporting systems not just to streamline the reporting process, but to transform how decisions are made, data is shared and client trust is built. The benefits go beyond saving time, they redefine the way organizations handle data collection, analysis and presentation across departments.
2.1 Efficiency and Time Savings
The most immediate benefit of adopting automated reporting tools is the time it saves. Instead of employees spending hours creating reports manually, businesses can automatically generate reports at scheduled intervals. This frees up teams from repetitive manual tasks so they can focus on strategy, problem-solving and improving outcomes. Over time, the hours saved compound into significant cost reductions.
2.2 Improved Data Accuracy and Consistency
Even the most skilled analysts can make mistakes when dealing with large spreadsheets or manual data entry. Automated reporting systems drastically reduce human error by ensuring that every calculation and data processing step follows a standardised workflow. The result: accurate data presented consistently, regardless of the report type or frequency.
2.3 Enhanced Collaboration and Accessibility
In many organizations, data often sits in silos across different departments. With report automation, all relevant stakeholders gain access to a unified version of the truth. Whether it’s the finance team reviewing cash flow statements or the marketing team analyzing campaign dashboards, everyone sees the same numbers. This shared visibility encourages collaboration and minimizes miscommunication.
2.4 Real-Time Insights for Faster Decision-Making
A major advantage of automating data collection is access to real-time data. Executives no longer have to wait for the end of the month to see how they are performing. Automated reporting provides real-time insights that allow businesses to pivot strategies quickly, optimize campaigns mid-flight, or adjust spending before problems escalate.
2.5 Strategic Benefits for Agencies → Retention and Transparency
For agencies, it’s a client retention strategy. Regular, transparent reporting shows clients exactly how their investments are performing. Delivering interactive reports or weekly updates builds trust and reduces the need for constant check-in calls. By combining automation with human commentary, agencies can provide both the numbers and the story behind them, strengthening long-term relationships.
2.6 Advanced Reporting Capabilities for Financial Teams
In finance, automated reporting software goes beyond basic spreadsheets. It can consolidate financial data from multiple sources, streamline financial reporting processes and automatically prepare compliance-ready documents. CFOs and finance managers benefit from data validation, data security, and the ability to produce reliable financial statements without last-minute scrambles. This efficiency not only improves reporting speed but also enhances credibility with auditors and investors.
2.7 Improved Data Visualization and Storytelling
Automated systems don’t just crunch numbers—they also help teams present data in more engaging formats. By leveraging interactive dashboards and data visualization, businesses can turn complex datasets into data stories that resonate with both technical and non-technical audiences. This ensures that reports are not only informative but also actionable.
2.8 Enabling Informed Decisions with Actionable Insights
Ultimately, the true benefit of report automation lies in its impact on decision-making. With access to consistent, up-to-date information, leaders can analyze data with confidence and make informed decisions. Whether it’s reallocating marketing budgets, identifying operational bottlenecks, or planning new investments, actionable insights derived from automated reports drive growth and competitiveness.
With automation, reporting shifts from a manual chore to a strategic advantage, keeping every decision fast, accurate, and transparent.
3. The Human Element: Why Not Fully Automate?
Automation is powerful, but numbers alone rarely tell the whole story. Even with the best automated reporting tools and advanced analytics, raw data without context can mislead decision-makers. Automated reporting software can collect data, analyze data and create interactive reports, but it cannot interpret nuances, trends or anomalies in the way a human can.
For instance, a spike in marketing data or a drop in financial statements might look alarming in a dashboard, but only an account manager or analyst can assess whether it’s seasonal, experimental, or caused by external factors. Human oversight ensures data accuracy, highlights key metrics and adds actionable insights that automated systems alone may miss.
Moreover, integrating a human element reduces human error from misinterpretation of dashboards, ensures data validation and allows for richer storytelling with data stories that resonate with stakeholders. The combination of automated data and expert analysis creates a balance where real-time insights meet strategic understanding, empowering teams to make informed, confident decisions.
4: Frameworks for Automated Reporting

A structured framework transforms manual reporting into a streamlined, repeatable process that saves time and reduces errors. At its core, automated reporting systems follow a workflow that moves raw data through data integration, processing and visualization, producing interactive dashboards and customizable reports for stakeholders.
Typical Workflow:
Data Collection – Gather data from multiple sources, including Google Analytics, Google Sheets, CRM systems and financial reporting processes. Automating data collection ensures real-time data and reduces manual data entry errors.
Data Validation & Quality Checks – Implement robust security measures, data encryption and data validation to ensure accurate data and compliance with data security protocols.
Data Processing & Integration – Use business intelligence (BI) tools or automation tools to merge multiple data sources, normalize formats and transform information into actionable insights. ReportDash Datastore can help centralize this existing systems data for seamless data analysis.
Calculation of Key Metrics – Compute key performance indicators (KPIs), financial statements, cash flow statements and operational reporting metrics to provide clarity on performance.
Report Automation & Visualization – Generate automated reports, interactive dashboards and data stories using reporting software like Google Data Studio, Looker Studio or Power BI. Automation ensures up-to-date information and reduces human error.
Distribution & Action – Share interactive reports and customizable dashboards with relevant stakeholders in real-time, ensuring decisions are informed by accurate data and actionable insights.
Example:
A marketing agency using ReportDash run a weekly automated reporting process where campaign performance is pulled from multiple data sources, combined into an interactive dashboard and is shared via email or Slack. Analysts can then add context, making numbers meaningful for clients and improving retention and transparency.
By following a well-defined framework, businesses can create automated reports efficiently, maintain data quality and free teams from repetitive manual tasks, enabling focus on strategic initiatives rather than operational reporting.
5: Tools & Technology Landscape
Choosing the right automated reporting tools is crucial for implementing a seamless reporting process. These tools help organizations automate data collection, maintain data accuracy and deliver real-time insights to key stakeholders.
1. Business Intelligence (BI) Tools:
Power BI, Tableau, Looker Studio, Domo – Enable data visualization, interactive dashboards and advanced analytics.
Provide customizable dashboards for operational reporting and financial reporting processes.
Integrate with multiple data sources including Google Sheets, Google Analytics, CRMs and databases to ensure accurate data consolidation.
2. Workflow Automation Tools:
Make.com, Zapier, Integromat – Facilitate report automation, automating data collection and connecting existing systems without heavy technical expertise.
Automate manual tasks, like aggregating marketing data, sending weekly reports and notifying key stakeholders via Slack or email.
3. Supporting Infrastructure:
AWS Lambda or other serverless platforms allow running Python scripts for automated data processing, data validation and enrichment.
ReportDash, Airtable and similar tools store raw data and aggregated metrics, acting as intermediate data sources before visualization.
4. PDF & Report Generation Tools:
Tools like PDF Generator API convert data stories and interactive reports into shareable PDFs for clients.
Helps ensure that reporting capabilities are not limited to dashboards; reports are ready for stakeholders in a user-friendly interface.
5. Data Connector & Aggregation Tools:
Platforms like ReportDash, Supermetrics and Funnel.io simplify data integration from multiple sources, helping agencies collect data from marketing platforms and consolidate it into one reporting system.
6. AI & Scripting Tools:
ChatGPT, Gemini, Claude and other AI models can assist in generating custom scripts, cleaning financial data or creating human-readable insights from raw data.
Supports financial reporting, marketing reporting and other reporting systems by reducing human error and speeding up reporting software workflows.
7.Integration & Security:
A strong automated reporting system ensures data security through data encryption, robust security measures and controlled data access.
Centralized tools improve data integration, accuracy and real-time insights, giving key stakeholders up-to-date information to make informed decisions.
By combining BI tools, workflow automation platforms, data connectors and supporting infrastructure, businesses can fully leverage automated reporting systems, reduce reliance on manual reporting and provide accurate, actionable insights to relevant stakeholders.
6: Reporting Practical Examples
Understanding automated reporting becomes clearer when we see it applied across real-world scenarios. Below are examples spanning agencies, marketing teams and finance departments:
1. Agency Weekly Reporting
Many agencies generate weekly reports for clients to show progress on marketing campaigns, lead generation or social media performance.
Using automated reporting tools like ReportDash, Supermetrics and Funnel.io, agencies can collect data from multiple data sources like Google Analytics, ad platforms, email marketing tools and consolidate it into interactive dashboards or PDF reports.
Automation tools handle data processing, aggregation, and report generation, while account managers provide human interpretation, highlighting key metrics and trends for clients.
This approach reduces manual data entry, human error and ensures up-to-date information is always available for stakeholders.
2. Marketing Campaign Reporting
Marketing teams rely on automated reporting systems to track customer data, campaign performance and key performance indicators across multiple channels.
By integrating Looker Studio, Google Sheets and BI tools, teams can analyze data in real time and create interactive dashboards to monitor marketing data efficiently.
Report automation ensures accurate data consolidation from multiple sources, helping teams generate actionable insights quickly and inform decisions on campaign adjustments.
3. Finance Reporting
Financial departments use automated reporting software to generate cash flow statements, financial statements, and other financial reporting processes.
By connecting financial data from ERP systems, bank feeds and spreadsheets, companies can automatically generate reports with accurate data and interactive dashboards for key stakeholders.
Using automation tools reduces manual reporting, manual data entry and errors, improving data accuracy, compliance and transparency.
4. Cross-Departmental Reporting
Organizations often need operational reporting that integrates data from multiple departments, including sales, marketing and finance.
Implementing automated reporting systems allows teams to collect data, process it and present interactive reports for relevant stakeholders, ensuring everyone has real-time insights and up-to-date information.
These practical examples demonstrate that types of automated reporting can vary by department and objective, but all rely on automation tools, data integration and a combination of human insight to transform raw data into actionable insights.
7: Best Practices for Successful Automated Reporting
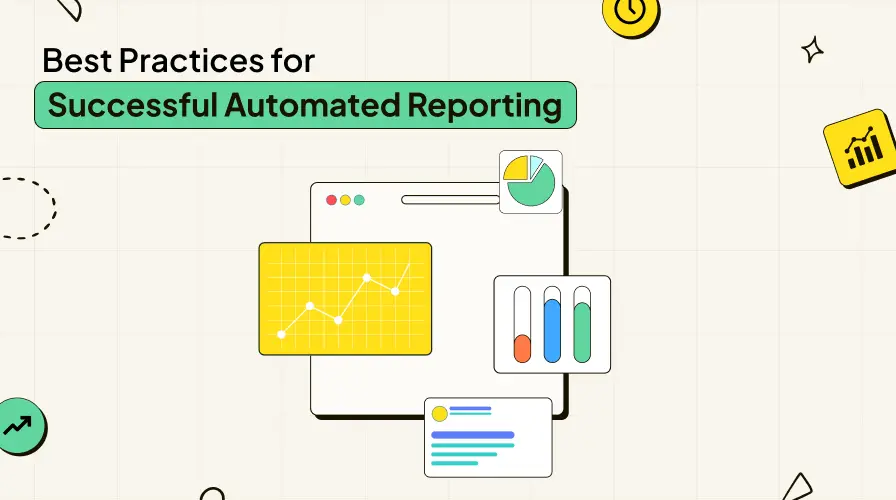
Implementing automated reporting systems is one thing, but doing it effectively requires adherence to best practices. These ensure data accuracy, actionable insights and smooth adoption across teams.
1. Define Clear Goals & KPIs
Identify key metrics and performance indicators that align with business objectives.
Decide whether the focus is financial reporting, marketing data analysis, or operational reporting.
Clear goals help in selecting the right automated reporting tool and customizable dashboards.
2. Ensure Data Quality
Accurate data is the foundation of any reporting process.
Implement data validation, data cleansing and automating data collection from multiple sources.
Tools like ReportDash can help integrate data seamlessly from existing systems to reduce manual tasks and human error.
3. Add Human Interpretation Layer
Numbers alone don’t tell the full story.
Assign analysts or account managers to interpret raw data, create data stories and provide context for key stakeholders.
This ensures reports are actionable, not just a collection of key metrics.
4. Test & Monitor Workflows
Automated reporting software should be tested regularly to ensure data accuracy and smooth operation.
Monitor for system errors, data inconsistencies or delays in report automation.
5. Keep Transparency as a Guiding Principle
Share reports in a user-friendly interface with interactive dashboards.
Transparency in reporting fosters trust among clients and internal teams, strengthens client relationships and improves decision-making.
6. Optimize Data Access & Security
Ensure data access is controlled and implement robust security measures like data encryption and access management.
Automated reporting tools should comply with data security standards to protect financial data and customer data.
By following these best practices, organizations can fully leverage automated reporting tools to generate reliable, actionable and visually engaging reports that empower relevant stakeholders to make informed decisions.
8: Challenges to Watch Out For
While automated reporting systems bring efficiency and accuracy, organizations must be aware of potential challenges to avoid pitfalls in implementation.
1. Data Silos
Multiple data sources can create fragmented insights if data integration is not properly implemented.
Siloed data reduces accuracy, actionable insights and the value of interactive dashboards.
2. Governance & Compliance
Automated systems often handle sensitive financial data and customer data.
Organizations must implement robust security measures and ensure compliance with regulations, including data encryption and controlled data access.
3. Scaling Issues
As businesses grow, reporting systems must handle larger volumes of data and more stakeholders.
Tools must support automating data collection, real-time insights and interactive dashboards without slowing down or compromising data quality.
4. Technical Expertise
Some types of automated reporting software require technical expertise for setup and maintenance.
Selecting user-friendly interfaces and automation tools can mitigate complexity and improve adoption.
Recognizing and preparing for these challenges ensures that automated reporting systems deliver reliable data, insightful analysis and actionable outputs without disrupting business operations. Proper planning keeps data stories consistent, key stakeholders informed and reporting processes scalable.
9: Future of Automated Reporting
The landscape of automated reporting is evolving rapidly, driven by advances in AI, data analytics, and business intelligence. Businesses that adopt these innovations can stay ahead by generating real-time insights and making informed decisions faster.
1. AI-Driven Insights
AI can process multiple data sources simultaneously, identify patterns, and generate actionable insights.
Predictive models can alert teams about trends in marketing data, financial statements, or customer data before they become critical.
2. Predictive Analytics
Beyond static reporting, organizations can use advanced analytics to forecast cash flow statements, campaign performance and key performance indicators (KPIs).
This shifts reporting from descriptive to proactive decision-making, giving businesses a competitive edge.
3. Natural Language Summaries
Automated reporting tools are increasingly integrating AI-generated summaries, converting raw data into easy-to-understand narratives.
Teams can quickly grasp insights without manually sifting through data visualization dashboards or interactive reports.
4. Enhanced Client-Facing Portals
Platforms are moving toward interactive dashboards and customizable reporting portals, offering real-time data access to clients.
This improves transparency, retention and client trust by providing up-to-date information on key metrics and reporting processes.
5. Integration with Automation Tools
The future combines automation tools, data processing systems and reporting software to streamline report automation across departments.
Businesses will increasingly rely on data validation, data security and robust security measures to maintain accurate data while scaling operations.
As automated reporting systems become smarter and more user-friendly, organizations can transform manual reporting into actionable, real-time insights. The future emphasizes accuracy, transparency and efficiency, enabling teams and clients to make confident, data-driven decisions across marketing, finance and operational reporting.
What’s Your Take?
Automated reporting is transforming how businesses handle data collection, analysis and reporting. The combination of automation tools, human insight and robust data processes enables teams to generate accurate, actionable insights while saving time and reducing manual tasks. ReportDash make it easier to integrate multiple data sources, build interactive dashboards and maintain real-time data for informed decisions.
Are you eager to be an early adopter of the best automated reporting tools? Sign up and explore today.
Create your reports once, and let ReportDash handle the rest. Schedule and automate updates effortlessly so your data refreshes in real-time—whether in Google Sheets, Looker Studio, or your dashboards. Get the insights you need with the most relevant data at all times, without the hassle of manual updates. It’s time to bring the excitement back into reporting.