

Reliable data pipeline and warehouse.
Prefetched data for faster loads.
Supports Looker Studio, BigQuery and more.
Legacy Reportdash Platform.
Data fetched on demand.
Export to Google Sheets or Looker Studio.

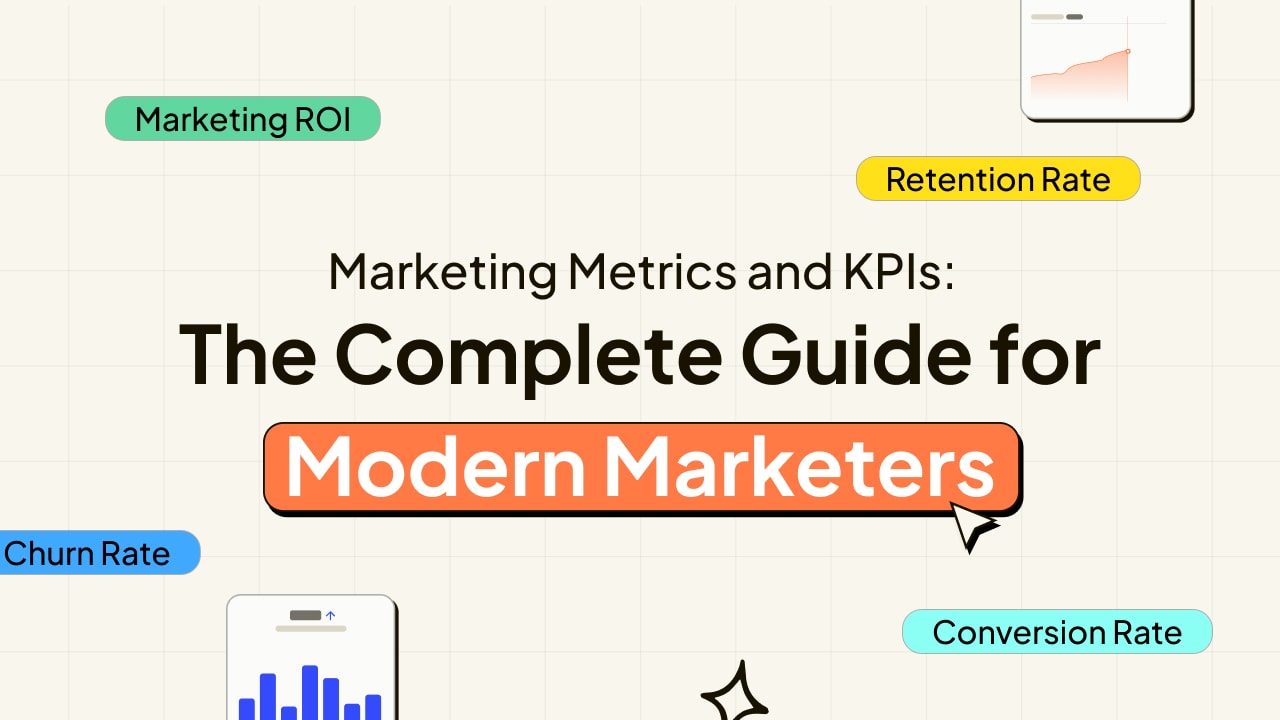
In today's data-driven landscape, marketing metrics and KPIs (Key Performance Indicators) are the backbone of strategic decision-making for every marketing department. These indicators help teams track the effectiveness and efficiency of marketing campaigns, reveal what's driving results, and highlight areas that need refinement.
The challenge for modern marketers isn't just collecting data, it's knowing which metrics matter most and how to transform raw numbers into actionable insights.
Whether you're a performance marketer optimizing ad spend, a growth marketer building acquisition funnels, or an agency managing multiple client campaigns, understanding the right marketing metrics is essential for proving ROI and scaling successful initiatives. This comprehensive guide will walk you through the most critical metrics across every marketing channel, helping you build a measurement framework that delivers real business impact.
What are marketing metrics and KPIs?
Marketing metrics are quantitative measurements that assess the performance of marketing activities and campaigns. KPIs (Key Performance Indicators), on the other hand, are specific, high-impact metrics directly linked to business goals and success. The primary distinction is that while all KPIs are metrics, not all metrics qualify as KPIs. KPIs focus on the numbers that truly move the business forward.
Think of it this way: if your website traffic increases by 50% but conversions remain flat, traffic is just a metric. However, if that traffic growth translates into more marketing qualified leads and ultimately drives revenue, then traffic becomes a KPI worth tracking.
Core marketing KPIs every business should track
Core marketing KPIs are the essential metrics that directly connect marketing performance to business goals. These aren't just numbers on a dashboard—they're the key performance indicators that help marketing teams prove ROI, optimize spending, and drive sustainable growth. For cost-conscious marketers managing tight budgets, focusing on these core KPIs ensures every dollar of marketing investment delivers measurable impact.
KPI | What It Measures | Why It Matters | Typical Benchmark |
|---|---|---|---|
Customer Acquisition Cost (CAC) | Total cost to acquire one new customer | Tracks spend efficiency and profit margins | 3:1 LTV to CAC ratio |
Customer Lifetime Value (CLV) | Total revenue from a customer over their lifetime | Guides marketing investment and retention strategy | $500-$5,000+ (varies by industry) |
Marketing ROI | Return on marketing investment | Quantifies contribution to business growth | 5:1 or higher |
Conversion Rate | Percentage converting at each funnel stage | Identifies strengths and bottlenecks in marketing funnel | 2-5% for landing pages |
Lead-to-Customer Rate | Percentage of qualified leads becoming customers | Evaluates lead quality and sales alignment | 10-20% industry average |
Churn Rate | Percentage of customers lost per period | Measures retention effectiveness | <5% monthly for SaaS |
Retention Rate | Percentage of customers retained over time | Drives long-term growth and loyalty | >90% for subscription models |
Net Promoter Score (NPS) | Customer likelihood to recommend | Gauges satisfaction and growth potential | 50+ is excellent |
Customer Acquisition Cost (CAC)
Customer acquisition cost represents the total marketing investment required to acquire one new customer. This includes all marketing campaigns, ad spend, content creation, and team costs divided by the number of new customers acquired. For marketing teams using platforms like ReportDash to track data across Google Analytics, social media platforms, and paid channels, calculating accurate CAC becomes straightforward with unified reporting.
Calculation:
CAC = Total Marketing Spend ÷ Number of New CustomersKey Insight: CAC should decrease over time as marketing strategies become more efficient and existing customers provide referrals.
Customer Lifetime Value (CLV)
Customer lifetime value measures the total revenue a customer generates throughout their relationship with your business. This key marketing metric helps marketing departments understand how much they can afford to spend on acquisition while maintaining profitability. Existing customers typically have higher CLV due to repeat purchases and lower service costs.
Calculation: Average Purchase Value × Purchase Frequency × Customer Lifetime
Strategic Value: CLV guides budget allocation across different marketing channels and helps prioritize retention over acquisition when appropriate.
Marketing ROI
Marketing ROI is the ultimate measure of marketing success, showing the revenue generated for every dollar spent on marketing initiatives. Unlike vanity metrics like website traffic or social media followers, marketing ROI directly connects marketing performance to business growth. Marketing teams should track ROI by channel, campaign, and time period to optimize future investments.
ROI VS ROI: Which is more important?
Calculation:
Marketing ROI = (Revenue Attributed to Marketing - Marketing Investment) ÷ Marketing Investment × 100Best Practice: Track both short-term ROI (immediate conversions) and long-term ROI (including customer lifetime value).
Conversion Rate Optimization
Conversion metrics at each stage of the marketing funnel reveal where potential customers drop off and where optimization efforts should focus. From website visitors becoming leads to marketing qualified leads becoming sales qualified leads, each conversion point offers improvement opportunities.
Key Conversion Points:
Website traffic to leads (typically 1-3%)
Marketing qualified leads to sales qualified leads (25-40%)
Sales qualified leads to customers (20-30%)
Landing page conversion rates (varies by industry and traffic source)
Lead Quality Metrics
The lead-to-customer rate measures how effectively your marketing campaigns generate qualified leads that convert to paying customers. High-quality leads from content marketing, email marketing, and targeted ads typically convert at higher rates than broad-awareness campaigns. Marketing teams should work closely with the sales team to define lead quality criteria and improve handoff processes.
Customer Retention Indicators
Churn rate and retention rates are critical for businesses with recurring revenue models. These metrics reveal the long-term effectiveness of marketing strategies beyond initial acquisition. Marketing qualified leads who become long-term customers provide the highest ROI, making retention campaigns often more profitable than acquisition efforts.
Net Promoter Score (NPS)
Net Promoter Score measures customer satisfaction and likelihood to recommend your business. High NPS scores correlate with organic growth through referrals, reducing customer acquisition cost over time. Marketing teams can use NPS data to identify brand advocates for case studies and referral programs.
By focusing on these right marketing metrics, marketing departments can prove their impact on business goals, optimize marketing budget allocation, and build sustainable growth strategies that deliver results for cost-conscious organizations.
Digital Marketing Metrics
Digital marketing metrics are the foundation of modern marketing performance measurement, providing marketing teams with granular insights into how website visitors interact with their brand online. Unlike traditional marketing channels, digital platforms offer unprecedented tracking metrics capabilities, allowing marketing departments to measure everything from initial awareness through final conversion and beyond.
Website & Engagement Metrics
Website metrics reveal how effectively your digital presence converts website visitors into potential customers. These traffic metrics are essential for understanding user behavior and identifying optimization opportunities across your marketing funnel.
Bounce Rate: The percentage of visitors who leave your site after viewing only one page. High bounce rates often indicate poor landing page relevance, slow load times, or misaligned target audience expectations. For marketing campaigns driving traffic to specific pages, bounce rate helps measure campaign quality and page effectiveness.
Time on Site: Average duration visitors spend on your website. Longer engagement times typically correlate with higher interest and better lead quality. Content marketing efforts should aim to increase time on site through valuable, relevant content that keeps potential customers engaged.
Page Views per Session: The number of pages viewed during a single visit. Higher page views suggest strong content engagement and effective internal linking. This metric helps marketing teams understand which content drives deeper exploration of their offerings.
Scroll Depth: How far down the page visitors scroll before leaving. This website metrics reveals content engagement quality and helps optimize landing page layouts for better conversion rate performance.
Exit Rate: The percentage of visitors who leave your site from a specific page. Unlike bounce rate, exit rate shows where visitors naturally conclude their journey. High exit rates on key conversion pages may indicate optimization opportunities.
Load Speed: Website performance directly impacts both user experience and search rankings. Slow-loading pages increase bounce rates and reduce conversion metrics, making speed optimization crucial for marketing success.
Mobile Responsiveness Score: With mobile traffic dominating most industries, ensuring optimal mobile experience affects all digital marketing efforts. Poor mobile performance reduces conversion rate across all marketing channels.
Lead Generation & Funnel Metrics
Lead generation metrics directly connect website traffic to business goals, measuring how effectively your digital presence converts visitors into marketing qualified leads. These conversion metrics are critical for optimizing marketing investment and improving lead quality.
Cost Per Lead (CPL): Total marketing investment divided by the number of leads generated. Marketing teams should track CPL by source to identify the most efficient marketing channels and optimize budget allocations accordingly.
Form Submission Rate: The percentage of website visitors who complete lead capture forms. This metric reveals landing page effectiveness and form optimization opportunities. A/B testing different form lengths and placements can significantly improve this conversion rate.
Lead Score: A composite ranking system that evaluates lead quality based on demographics, behavior, and engagement. Higher lead scores typically indicate better fit and higher likelihood of conversion to sales qualified leads.
MQL to SQL Conversion Rate: The percentage of marketing qualified leads that the sales team accepts as sales qualified leads. This metric measures lead quality and alignment between marketing and sales teams. Poor MQL to SQL rates may indicate targeting issues or misaligned qualification criteria.
Landing Page Conversion Rate: The percentage of landing page visitors who complete the desired action (form submission, download, purchase). This conversion rate varies significantly by traffic source, with targeted ads typically converting higher than organic traffic.
AI-Powered Tracking
Modern analytics tools now incorporate artificial intelligence to provide deeper insights into marketing performance and customer behavior. These advanced tracking metrics help marketing teams make more informed decisions and predict future performance.
Sentiment Analysis: AI analysis of social media mentions, reviews, and support interactions to gauge customer perception. This helps marketing departments understand brand mentions quality and adjust messaging strategies accordingly.
Brand Mentions & Share of Voice: AI-powered monitoring of brand mentions across social media platforms, news sites, and forums. This metric helps track brand awareness and competitive positioning relative to industry peers.
Predictive Engagement Score: Machine learning algorithms analyze user behavior to predict likelihood of future engagement or conversion. This helps marketing teams prioritize follow-up efforts and personalize outreach strategies.
AI-generated Persona Match Rate: Advanced analytics that match website visitors and leads to ideal customer profiles. This helps marketing organizations understand how well their marketing campaigns attract their target audience and adjust targeting accordingly.
These digital marketing metrics work together to provide a comprehensive view of online marketing performance. By tracking these key marketing metrics marketing teams can focus on optimization strategies that drive real business goals.
SEO Metrics and KPIs
SEO metrics are critical key performance indicators that demonstrate how effectively your content marketing and organic search strategies drive website traffic and contribute to business goals. Unlike paid advertising where results are immediate, SEO requires consistent monitoring of tracking metrics that show long-term progress and marketing success.
For marketing teams managing multiple clients or campaigns, platforms like ReportDash can consolidate SEO data from tools like Google Analytics, SEMrush, and other analytics tools into unified dashboards, making it easier to track performance across different marketing channelsand demonstrate marketing ROI to stakeholders.
Performance Metrics
Organic Traffic: The number of website visitors arriving through unpaid search results. This foundational website metrics shows the reach of your SEO efforts and directly correlates with content quality and keyword optimization. Marketing teams should track organic traffic trends, seasonal patterns, and traffic by landing page to identify top-performing content and optimization opportunities.
Keyword Rankings: Position tracking for target keywords in search results, typically measured for top 3, top 10, and top 100 rankings. Higher quality content that matches search intent typically achieves better rankings. Marketing departments should focus on ranking improvements for keywords that drive qualified leads rather than just high-volume terms.
Impressions vs. Clicks (CTR from Search): Search impressions show how often your pages appear in results, while click through rate measures how compelling your titles and descriptions are to searchers. Low CTR despite high impressions indicates opportunities to optimize meta descriptions and titles to attract more website visitors.
Bounce Rate from Organic Search: The percentage of organic visitors who leave after viewing one page. High bounce rates from organic traffic may indicate content-search intent misalignment or poor user experience. Marketing organizations should analyze bounce rates by landing page and keyword to improve content relevance.
Domain Authority/Page Authority: Third-party metrics that predict ranking potential based on link profile strength and other factors. While not direct Google ranking factors, these scores help marketing teams understand competitive positioning and link-building progress.
Core Web Vitals (LCP, FID, CLS): Google's official user experience metrics measuring loading performance, interactivity, and visual stability. These website metrics directly impact rankings and user experience, making them essential for marketing performance optimization.
Content/Link Metrics
Backlinks Acquired: The number of external websites linking to your content. Quality backlinks from relevant, authoritative sites significantly impact rankings and drive referral traffic. Marketing teams should track both quantity and quality of backlinks, focusing on links from industry-relevant sources.
Referring Domains: The number of unique websites linking to your site. This metric shows the diversity of your link profile, with links from multiple domains generally more valuable than many links from few domains. Content marketing strategies should aim to earn links from diverse, relevant sources.
Internal Link Distribution: How effectively you connect related content within your site. Strategic internal linking helps distribute page authority, improves user navigation, and helps search engines understand content relationships. Marketing departments should audit internal linking to ensure important pages receive adequate link equity.
Content Engagement Metrics: Including average time on page and scroll depth, these metrics show how well your content satisfies user intent. High engagement signals to search engines that content provides value, potentially improving rankings. Marketing initiatives should focus on creating content that genuinely helps the target audience rather than just targeting keywords.
SEO success requires patience and consistent effort, but these marketing metrics provide clear indicators of progress toward marketing success. Marketing organizations that master SEO metrics gain sustainable advantages in attracting potential customers without ongoing advertising costs.
Paid Advertising Metrics (Google Ads, Meta, etc.)
Paid advertising metrics are among the most important metrics for marketing teams managing marketing budget allocations across different marketing channels. Unlike organic efforts, paid campaigns provide immediate, measurable results that directly connect marketing investment to customer acquisition and revenue generation. These key performance indicators help marketing departments optimize ad spend, improve targeting accuracy, and maximize marketing ROI.
Ad Performance Metrics
Click-Through Rate (CTR): The percentage of people who click your ad after seeing it. Higher quality ads with relevant messaging and strong visual appeal typically achieve better CTRs. Marketing teams should benchmark CTR by platform and campaign type—search ads generally have higher CTRs than display ads, while social media platforms vary significantly by audience and content format.
Cost Per Click (CPC): The average amount paid for each ad click. CPC varies dramatically by industry, target audience, and competition levels. Marketing campaigns targeting competitive keywords or premium demographics typically have higher CPCs. Marketing teams should monitor CPC trends to identify when budget allocations need adjustment or when targeting refinements could improve efficiency.
Quality Score (Google Ads): Google's rating of ad relevance, landing page experience, and expected click-through rate. Higher Quality Scores reduce cost per lead and improve ad positioning. Marketing departments should optimize ad copy, landing page relevance, and keyword alignment to improve Quality Scores and reduce overall acquisition costs.
Conversion Rate from Ads: The percentage of ad clicks that result in desired actions (purchases, form submissions, downloads). This conversion rate reveals how well ad traffic aligns with landing page messaging and offer appeal. Low conversion rates may indicate audience targeting issues or landing page optimization opportunities.
Cost Per Acquisition (CPA): Total ad spend divided by number of conversions acquired. CPA directly measures the efficiency of customer acquisition efforts and should be compared against customer lifetime value to ensure profitability. Marketing teams should track CPA by campaign, audience segment, and time period to identify optimization opportunities.
Return on Ad Spend (ROAS): Revenue generated divided by ad spend, typically expressed as a ratio (e.g., 4:1 ROAS means $4 revenue for every $1 spent). ROAS is crucial for evaluating marketing performance and justifying marketing investment. Marketing organizations should set minimum ROAS thresholds based on profit margins and business goals.
Impression Share: The percentage of available impressions your ads actually received. Low impression share may indicate budget limitations or competitive bid pressure. Marketing teams can increase impression share through higher bids, larger budgets, or improved ad quality.
Frequency & Reach (Meta): Frequency measures how often the same person sees your ad, while reach counts unique individuals exposed. High frequency with low conversion metrics may indicate ad fatigue, requiring creative refreshes or audience expansion. Social media campaigns should balance reach and frequency based on campaign objectives.
Funnel & Attribution Metrics
View-Through Conversions: Conversions that occur after users see (but don't click) your ads. These conversion metrics are particularly important for display and video campaigns that build awareness and influence future projects even without immediate clicks. Marketing teams should track view-through conversions to understand the full impact of their advertising efforts.
Assisted Conversions: Conversions where ads played a supporting role in the customer journey without being the final touchpoint. These metrics reveal how different marketing channels work together to drive customer acquisition. Marketing departments using multi-channel strategies should analyze assisted conversions to optimize budget allocations across channels.
Attribution by Channel: Understanding which marketing channels receive credit for conversions helps optimize spending and strategy. First-click attribution shows initial awareness drivers, while last-click attribution reveals closing channels. Marketing teams should use attribution modeling that aligns with their customer lifetime and buying cycles.
Lifetime Value per Channel: The customer lifetime value of customers acquired through specific advertising channels. Some channels may have higher acquisition costs but deliver customers with greater long-term value. Marketing organizations should factor customer lifetime value into budget allocations rather than optimizing solely for lowest cost per lead.
Paid advertising metrics provide the most immediate feedback on marketing performance, making them essential for marketing teams focused on efficient customer acquisition. By tracking these key marketing metrics through integrated platforms like ReportDash, marketing departments can quickly identify winning combinations of audience, creative, and placement while eliminating underperforming elements.
The most successful marketing campaigns use these tracking metrics to continuously refine targeting, creative, and bidding strategies. Marketing teams that master paid advertising measurement gain significant advantages in customer acquisition cost optimization and marketing ROI improvement, enabling sustainable growth even in competitive markets.
Email Marketing Metrics
Email marketing remains one of the most cost-effective marketing channels, delivering exceptional marketing ROI when properly measured and optimized. These tracking metrics help marketing teams understand subscriber behavior, campaign effectiveness, and revenue contribution.
Engagement Metrics
Open Rate: The percentage of recipients who open your emails, calculated as opens divided by delivered emails. While iOS privacy updates have affected open rate accuracy, this metric still provides valuable insights into subject line effectiveness and sender reputation. Marketing teams should track open rates by segment, send time, and subject line type to optimize future campaigns.
Click-Through Rate (CTR): The percentage of email recipients who click links within your emails. CTR measures content relevance and call-to-action effectiveness, directly connecting email marketing efforts to website traffic and conversion metrics. Higher quality content and targeted messaging typically achieve better CTRs.
Click-to-Open Rate (CTOR): The percentage of email openers who click links, calculated as clicks divided by opens. CTOR isolates content performance from subject line effectiveness, helping marketing teams understand how well email content engages readers once opened. High open rates with low CTOR may indicate content-expectation misalignment.
Time to Open: How quickly recipients open emails after delivery. Faster open times suggest strong subscriber engagement and effective send time optimization. Marketing campaigns with urgent or time-sensitive offers should monitor this metric to ensure optimal timing and messaging.
Mobile vs Desktop Open Rate: The breakdown of opens by device type. With mobile dominating email consumption, marketing teams must ensure email templates render properly across devices. Poor mobile experience reduces engagement and hurts overall marketing performance.
List Health Metrics
Bounce Rate: The percentage of emails that fail to deliver, divided into hard bounces (permanent delivery failures) and soft bounces (temporary issues). High bounce rates damage sender reputation and reduce email marketing effectiveness. Marketing departments should regularly clean lists and implement double opt-in to maintain list quality.
Unsubscribe Rate: The percentage of recipients who opt out of future emails. While some unsubscribes are normal, sudden spikes may indicate content issues, frequency problems, or audience targeting misalignment. Marketing teams should track unsubscribe rates by campaign type and audience segment to identify optimization opportunities.
Spam Complaint Rate: The percentage of recipients who mark emails as spam. High spam rates severely damage deliverability and sender reputation. Marketing organizations should monitor spam rates closely and investigate causes of elevated complaints, such as poor list hygiene or misleading subject lines.
List Growth Rate: The net increase in subscribers over time, accounting for new signups minus unsubscribes and bounces. Positive list growth indicates effective lead generation and content value. Marketing teams should track growth by source to identify the most effective acquisition channels and lead generation strategies.
Revenue Metrics
Revenue per Email: Total revenue attributed to email campaigns divided by number of emails sent. This metric directly connects email marketing efforts to business goals and helps justify marketing investment in email programs. Marketing teams should track revenue per email by campaign type, audience segment, and sending frequency.
Email-attributed Conversions: The number of conversions (purchases, signups, downloads) directly traceable to email campaigns. Using proper tracking and attribution, marketing departments can understand how email marketing contributes to overall customer acquisition and revenue generation across the marketing funnel.
Cart Recovery Rate: For e-commerce businesses, the percentage of abandoned carts recovered through email campaigns. Cart abandonment emails often achieve high conversion rates because they target potential customers who have already shown purchase intent. Marketing teams should optimize cart recovery sequences to maximize revenue from existing customers and prospects.
Email marketing metrics provide detailed insights into subscriber behavior and campaign effectiveness, making them essential for marketing teams focused on nurturing qualified leads and retaining existing customers.
The most effective email marketing strategies use these key marketing metrics to continuously refine segmentation, timing, content, and automation sequences. Marketing organizations that master email measurement gain significant advantages in customer acquisition cost reduction and customer lifetime value optimization, enabling sustainable growth through one of the most direct communication channels available.
Social Media Metrics
Social media has evolved from a brand awareness channel to a critical driver of customer acquisition and revenue generation. These tracking metrics help marketing teams understand audience engagement, content performance, and conversion impact across social media platforms.
Engagement Metrics
Likes, Shares, Comments: Basic interaction metrics that indicate content resonance and audience engagement. While these are often considered vanity metrics, they provide valuable insights into content preferences and target audience behavior. Marketing teams should analyze engagement patterns to understand what content types drive higher quality interactions and brand mentions.
Engagement Rate per Post: Total interactions divided by reach or followers, showing how effectively content engages audiences. This metric normalizes performance across posts with different reach levels, helping marketing teams identify top-performing content regardless of audience size. Higher quality content typically achieves better engagement rates and drives more potential customers into the marketing funnel.
Save/Bookmark Rate: The percentage of users who save content for later viewing. This metric indicates content value and utility, often correlating with higher quality leads and increased customer lifetime value. Marketing campaigns with educational or reference content should track save rates to measure lasting impact.
Video Completion Rate: The percentage of viewers who watch videos to completion. High completion rates suggest compelling content that holds attention, which is crucial for marketing success on video-focused platforms like TikTok and Instagram Reels. Marketing teams should optimize video content based on completion data to improve overall marketing performance.
Check out how to measure the video marketing campaigns in detail.
Growth & Visibility Metrics
Follower Growth Rate: The net increase in followers over time, indicating brand awareness expansion and audience building success. While follower count alone doesn't guarantee marketing success, consistent growth suggests effective content strategy and audience targeting. Marketing departments should focus on attracting qualified leads rather than just maximizing follower count.
Reach vs. Impressions: Reach measures unique users exposed to content, while impressions count total views including repeat exposure. The ratio between these metrics reveals content virality and sharing effectiveness. Marketing teams should analyze reach-to-impression ratios to understand content amplification and optimize for brand mentions and organic distribution.
Hashtag Performance: Metrics showing how hashtags contribute to content discovery and engagement. Strategic hashtag use can significantly expand reach and attract potential customers searching for specific topics. Marketing organizations should track hashtag performance to identify trending topics and optimize content discoverability.
Brand Mention Frequency: The number of times your brand is mentioned across social media platforms, both in tags and untagged mentions. Brand mentions indicate awareness levels and provide opportunities for direct follow up and community engagement. Marketing teams should monitor mentions to identify brand advocates and address customer service issues promptly.
Conversion Metrics
Link Clicks: The number of users clicking links in social media posts, driving website traffic and potential conversions. Link clicks directly connect social media engagement to website metricsand conversion rate optimization. Marketing teams should track click-through patterns to understand which content types drive the most qualified leads.
Leads Generated: Marketing qualified leads directly attributed to social media activities, including form submissions, newsletter signups, and contact requests. This metric demonstrates social media's contribution to lead generation and helps justify marketing investment in social platforms. Marketing departments should track lead quality from social media sources to optimize targeting and content strategies.
Influencer ROI: Return on investment from influencer partnerships and collaborations. Marketing teams should measure influencer campaigns based on customer acquisition cost, conversion rate, and customer lifetime value rather than just engagement metrics. Effective influencer partnerships can significantly reduce acquisition costs while reaching new target audience segments.
Attribution from Social Touch points: Understanding social media's role in multi-touch customer journeys, including assisted conversions and influence on future campaigns. Social media often serves as an early touchpoint that influences later conversions through other marketing channels. Marketing organizations should use attribution modeling to understand social media's full contribution to marketing ROI.
The most effective social media strategies use these key marketing metrics to continuously refine content, targeting, and engagement tactics. Marketing organizations that master social media measurement gain significant advantages in brand mentions, customer acquisition cost optimization, and building communities of engaged potential customers who drive long-term business goals.
Business Impact & Strategic Metrics
Business impact metrics represent the highest level of marketing performance measurement, directly connecting marketing initiatives to revenue, pipeline, and strategic business goals. These key performance indicators help marketing departments demonstrate their contribution to company growth and justify marketing investment decisions. For marketing organizations seeking to prove their value and secure budget allocations, these strategic metrics are essential for executive reporting and long-term planning.
Marketing-Originated Pipeline: The total value of sales opportunities that marketing campaigns directly created through lead generation, events, content, and other marketing initiatives. This metric shows marketing teams' ability to generate new business opportunities and feed the sales team with qualified leads. Marketing departments should track pipeline creation by channel and campaign to optimize budget allocations toward the most effective customer acquisition strategies.
Marketing-Sourced Revenue: Revenue directly attributed to marketing campaigns and activities, demonstrating clear marketing ROI and business impact. This includes both direct conversions and influenced deals where marketing played a significant role. Marketing organizations should work closely with the sales team to establish proper attribution models that accurately reflect marketing's contribution to revenue generation and customer lifetime value.
Sales & Marketing Alignment Score: A composite metric measuring collaboration effectiveness between marketing teams and sales teams, including lead quality scores, handoff processes, and shared goal achievement. Strong alignment typically improves conversion rates from marketing qualified leads to sales qualified leads and reduces overall customer acquisition cost. Marketing departments should regularly assess alignment through feedback surveys and performance reviews.
CLTV to CAC Ratio: The relationship between customer lifetime value and customer acquisition cost, showing the long-term profitability of marketing investment. Healthy ratios (typically 3:1 or higher) indicate sustainable growth and efficient customer acquisition strategies. Marketing teams should track this ratio by channel and customer segment to optimize marketing strategies and budget allocations toward the most profitable acquisition methods.
Revenue by Campaign/Channel: Detailed revenue attribution across different marketing channels and specific marketing campaigns, enabling data driven decisions about future campaigns and marketing investment. This metric helps marketing organizations understand which marketing channels deliver the highest marketing ROI and deserve increased investment. Marketing teamsusing platforms like ReportDash can easily track revenue attribution across 50+ marketing sources.
% Pipeline Influenced by Marketing: The percentage of total sales pipeline that marketing activities influenced, even if not directly originated. This metric captures marketing's role in nurturing existing customers, supporting account expansion, and accelerating deal closure. Marketing departments should track influenced pipeline to demonstrate their full contribution to business goals beyond just new customer acquisition.
These strategic marketing metrics provide the clearest connection between marketing performance and business goals, making them essential for marketing teams seeking to prove their value and secure continued marketing investment.
The most successful marketing departments use these business impact metrics to align their activities with company objectives, optimize marketing budget allocation, and build strong partnerships with sales teams. Marketing organizations that master strategic measurement gain significant advantages in securing resources, proving marketing ROI, and driving long-term customer acquisition and retention success.
Conclusion
Aligning marketing metrics and KPIs with business outcomes is the foundation of successful marketing performance management. The most common mistake marketing teams make is focusing on vanity metrics like website traffic or social media followers without connecting them to customer acquisition, revenue, or customer lifetime value. Instead, successful marketing organizations prioritize the right marketing metrics that directly influence business goals and demonstrate clear marketing ROI.
Key best practices for marketing success include conducting regular metric audits to ensure tracking metrics remain relevant, implementing modern data management through platforms like ReportDash to eliminate manual data collection, and fostering cross-team alignment between marketing departments and sales teams to optimize the entire customer acquisition process.
Marketing teams should leverage integrated analytics tools like Google Analytics, HubSpot, ReportDash, SEMrush, and Meta Ads Manager to consolidate performance data across different marketing channels. This unified approach enables data driven decisions, improves marketing investment efficiency, and provides comprehensive views of how marketing initiatives contribute to customer lifetime value and sustainable growth.
The future of marketing performance lies in connecting granular conversion metrics across the entire marketing funnel—from initial website visitors to marketing qualified leads to existing customers—ensuring every dollar of marketing budget drives measurable impact toward business goals.

Clean, unified marketing data in a few clicks.

Unify cross-channel marketing data, preserve historical records, and generate reports faster. Your data, your way.